Sturdy Demand for Manufactured Goods from the US in August 2020
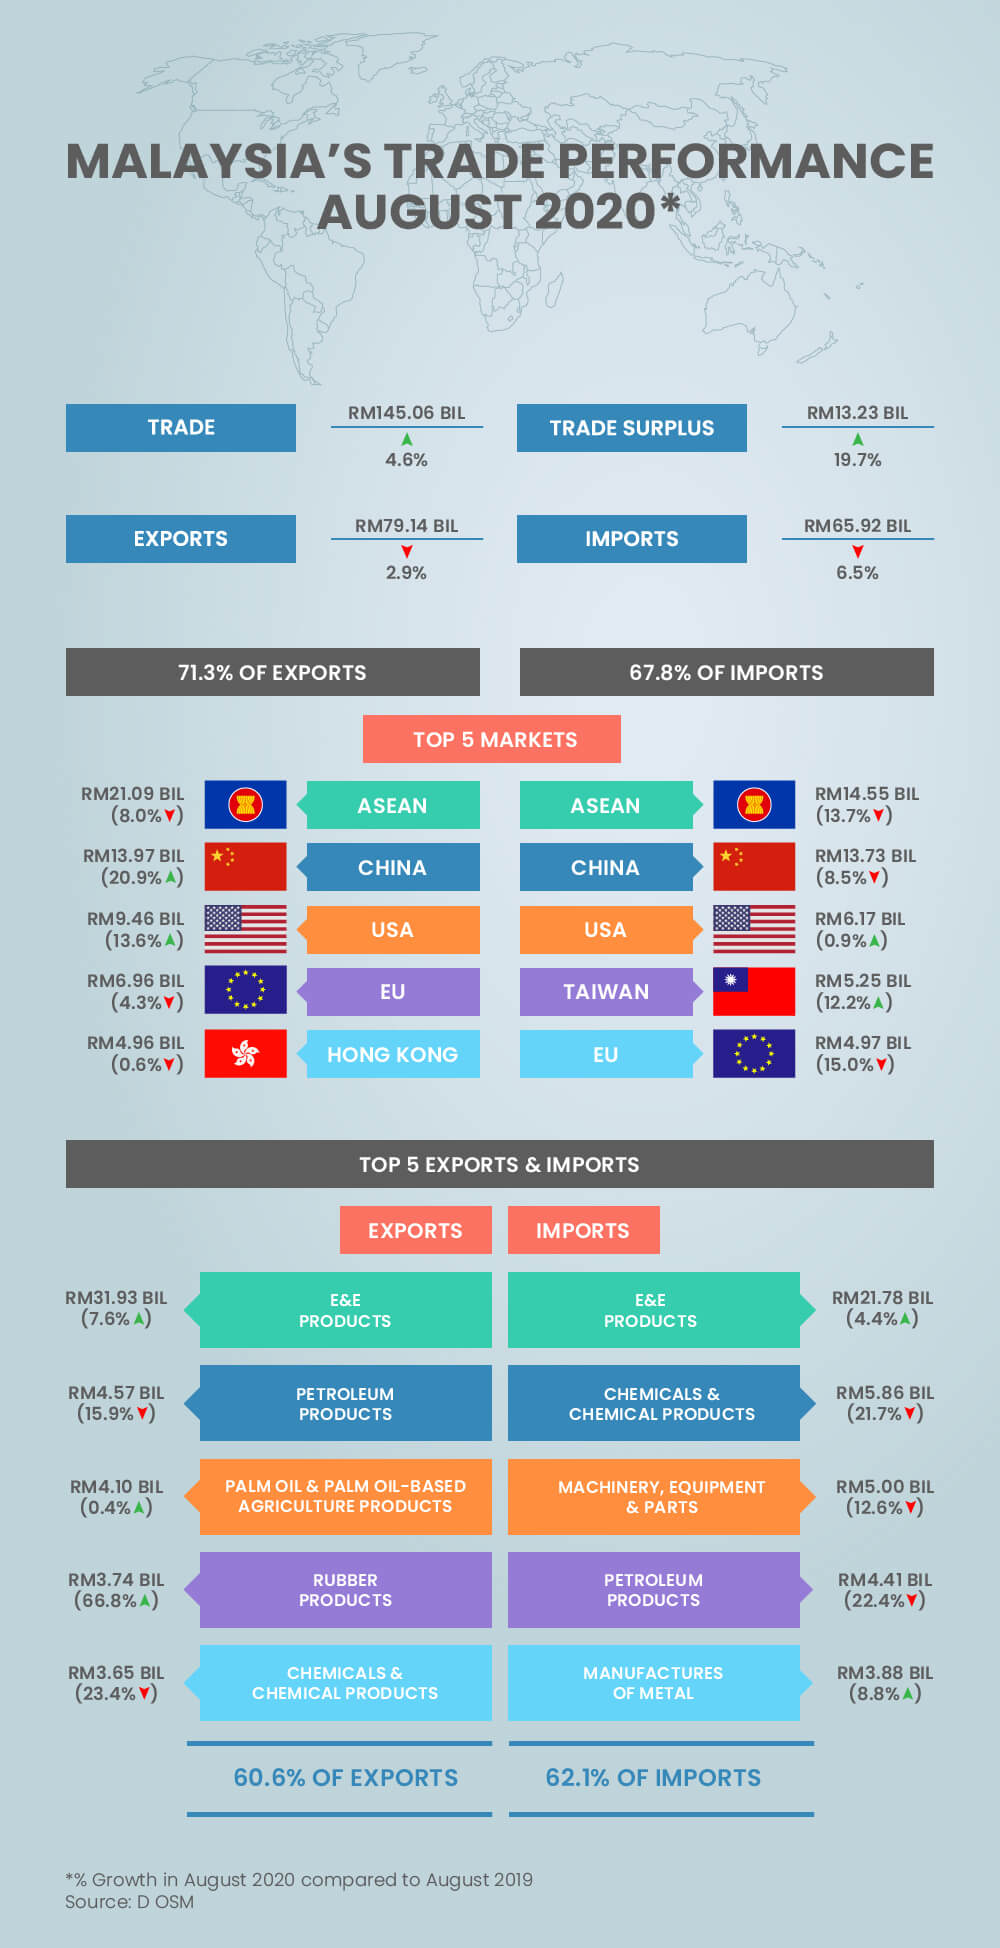
Trade with the US in August 2020 grew by 8.2% y-o-y to RM15.63 billion, representing 10.8% of Malaysia’s total trade. Exports to the US continued to expand for 3 consecutive months, recording a double digit growth of 13.6% to RM9.46 billion driven mainly by expansion in exports of manufactured goods. Higher demand for manufactured goods was seen especially for rubber products, wood products, optical and scientific equipment, machinery, equipment and parts as well as other manufactures (SSD). Imports from the US expanded by 0.9% to RM6.17 billion.
Compared to July 2020, trade, exports and imports shrank by 10.6%, 15.3% and 2.3%, respectively.
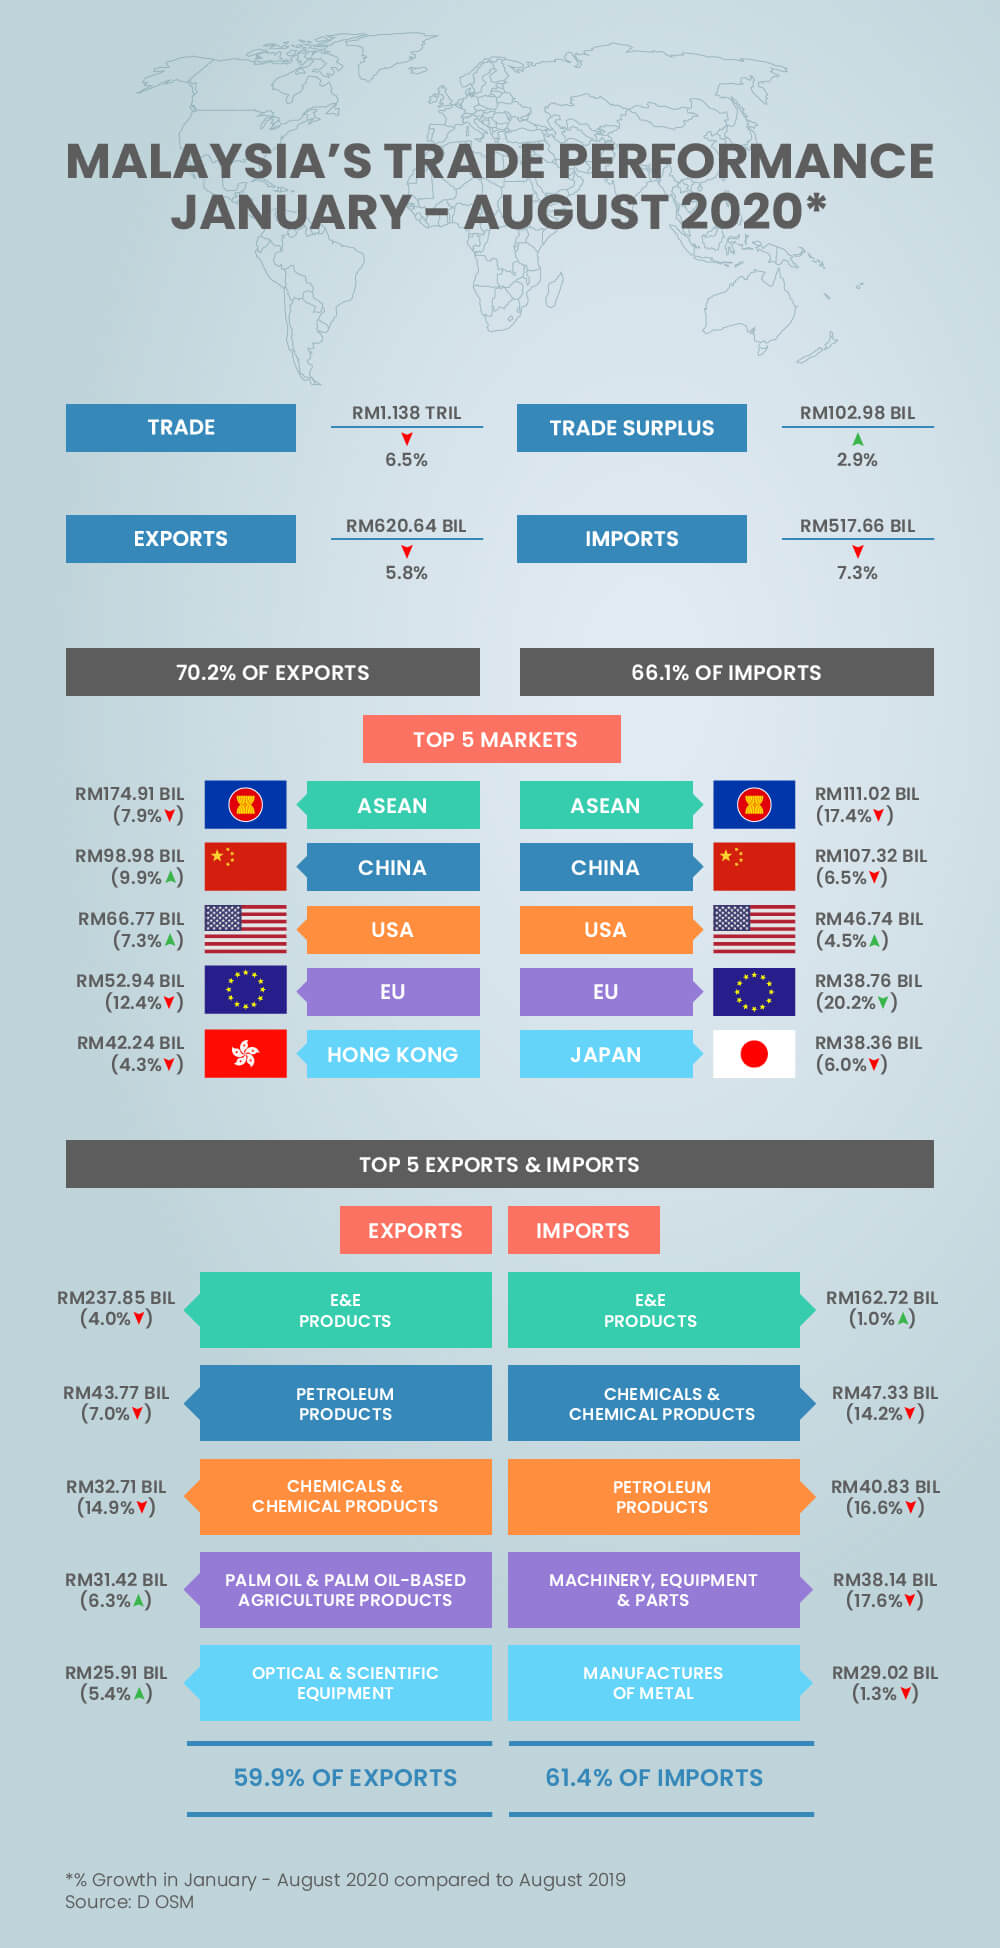
During the period of January to August 2020, trade with the US expanded by 6.1% to RM113.51 billion compared to the same period of 2019. Exports climbed by 7.3% to RM66.77 billion aided by higher demand for rubber products, wood products and other manufactures (SSD). Imports from the US climbed by 4.5% to RM46.74 billion.
Rubber Products and Palm Oil Cushioned Export Decline to the EU in August 2020
Total trade with the European Union (EU) which constituted 8.2% of Malaysia’s total trade in August 2020, decreased by 9.1% y-o-y to RM11.93 billion. Exports totalled RM6.96 billion, declined by 4.3%, underpinned mainly by lower exports of E&E products as well as manufactures of metal. Meanwhile, increases in exports were registered for rubber products as well as palm oil and palm oil-based agriculture products. Imports from the EU slid by 15% to RM4.97 billion.
Among the top 10 EU markets which accounted for 90.7% of Malaysia’s total exports to the EU, exports to 7 countries recorded increases namely, Germany (^7.6%), Italy (^24.9%), Spain (^4.9%), Slovenia (^57.5%), the Czech Republic (^27%), Poland (^11.9%) and Hungary (^0.5%).
On a m-o-m basis, trade and exports shrank by 4.5% and 9.8% respectively, while imports increased by 4.1%.
For the first 8 months of 2020, trade with the EU amounted to RM91.7 billion, a decline of 15.9% compared to the same period of 2019.
Exports totalled RM52.94 billion, a decrease of 12.4% owing to lower exports of E&E products. Higher exports however was recorded for rubber products as well as palm oil and palm oil-based agriculture products. Imports from the EU amounted to RM38.76 billion, a decrease of 20.2%.
Slower Trade with Japan in August 2020
In August 2020, trade with Japan which constituted 6.4% of Malaysia’s total trade fell by 10.5% y-o-y to RM9.23 billion. Exports decreased by 13.8% to RM4.31 billion following lower exports of LNG and manufactures of metal. Growth in exports was recorded for crude petroleum, optical and scientific equipment, rubber products as well as palm oil and palm oil-based agriculture products. Imports from Japan slipped by 7.2% to RM4.92 billion.
On a m-o-m basis, trade and exports decreased by 6.7% and 17% respectively, while imports increased by 4.7%.
For the period of January to August 2020, trade with Japan slumped by 7.9% to RM78.75 billion compared to the same period of 2019.
Exports dropped by 9.6% to RM40.39 billion mainly on lower exports of LNG. Higher exports however was registered for crude petroleum, rubber products, optical and scientific equipment as well as palm oil and palm oil-based agriculture products. Imports from Japan fell by 6% to RM38.36 billion
Trade with FTA Partners
In August 2020, trade with Free Trade Agreement (FTA) partners which accounted for 65.3% of Malaysia’s total trade recorded a decline of 5.5% y-o-y to RM94.77 billion.
Exports to FTA partners amounted to RM53.3 billion, decreased by 1.7% while imports contracted by 10% to RM41.47 billion.
Increases in exports however were recorded to the ROK, by 1.5% to RM2.83 billion and Turkey (^6% to RM575.6 million) on account of higher exports of E&E products.
Compared to July 2020, trade, exports and imports were down by 9.8%, 15.1% and 2%, respectively.
Trade with FTA partners for the first 8 months of 2020 which accounted for 66.5% of Malaysia’s total trade reduced by 6.4% to RM757.01 billion. Exports during this period amounted to RM424.05 billion, a decline of 5.5% while imports totalled RM332.96 billion, lower by 7.5%.
Import Performance
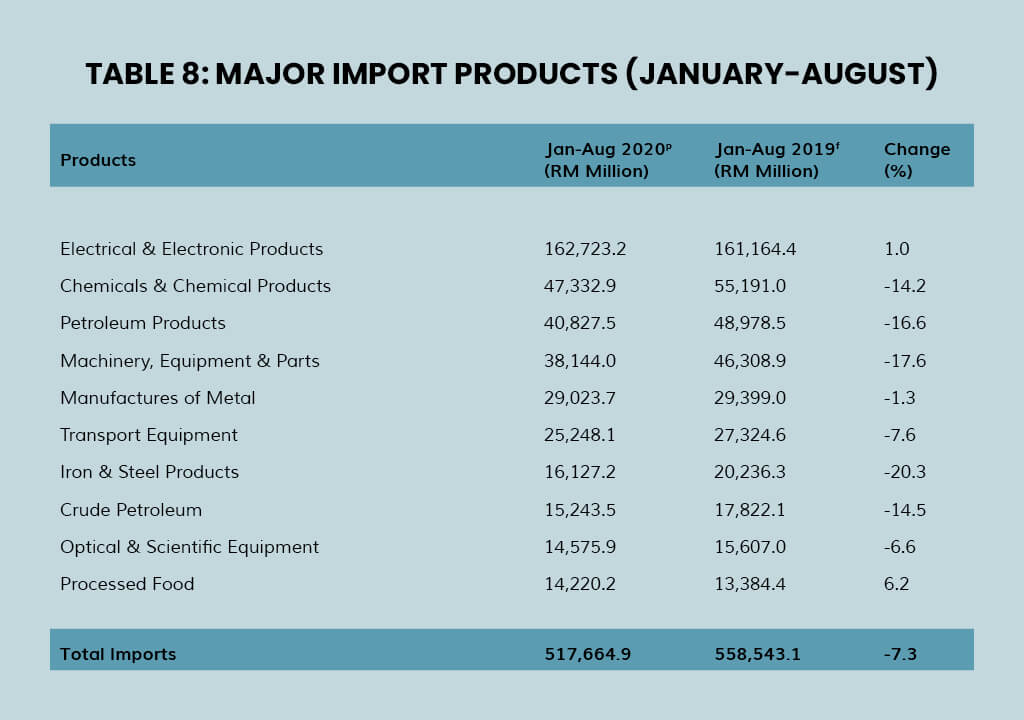
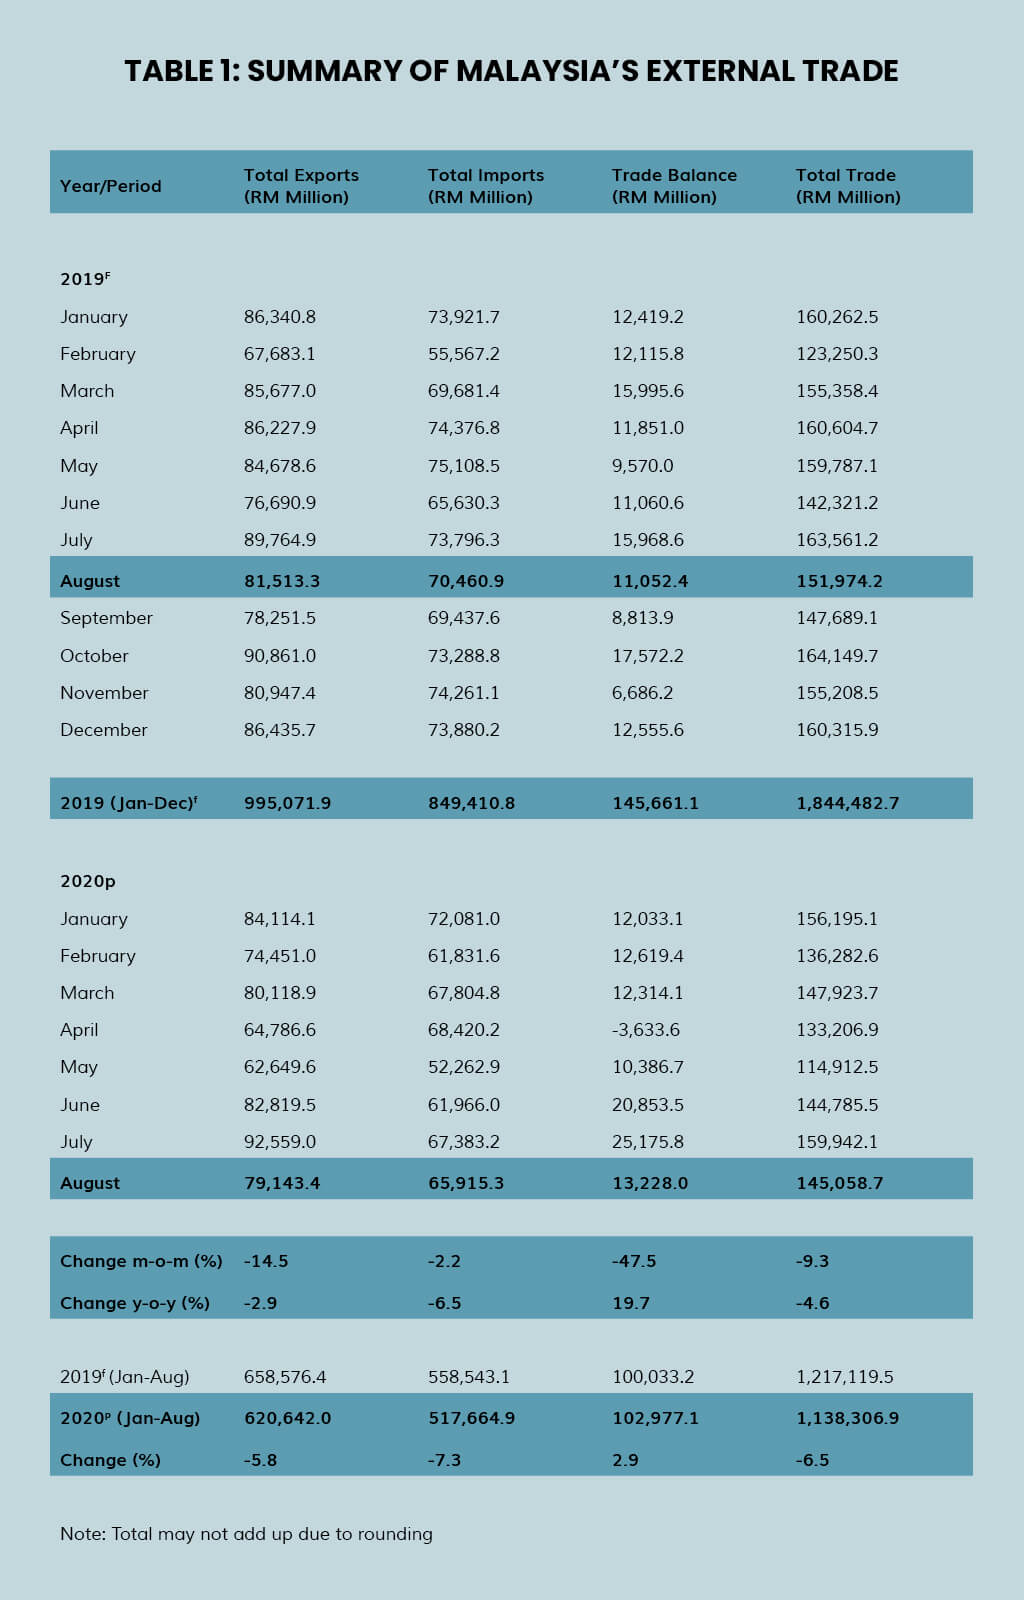
Total imports in August 2020 contracted by 6.5% y-o-y to RM65.92 billion from RM70.46 billion in August 2019. The three main categories of imports by end use which accounted for 75.9% of total imports were:
- Intermediate goods, valued at RM36.86 billion or 55.9% share of total imports, decreased by 5.6%, following lower imports of processed industrial supplies, particularly iron and steel;
- Capital goods, valued at RM6.81 billion or 10.3% of total imports, decreased by 15.5%, due mainly to reduced imports of capital goods (except transport equipment), primarily parts of machinery and mechanical appliances; and
- Consumption goods, valued at RM6.39 billion or 9.7% of total imports, rose by 2.9%, as a result of higher imports of durables, especially parts of machinery and mechanical appliances.
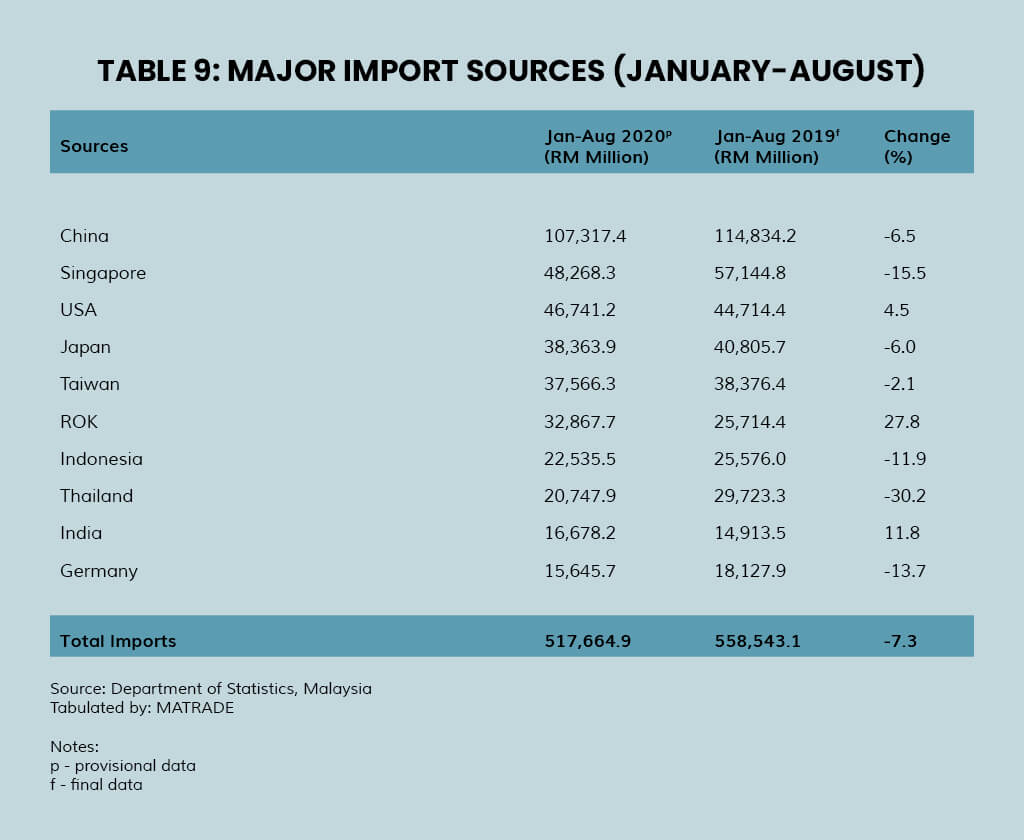
During January to August 2020, imports amounted to RM517.66 billion, decreased by 7.3% from the same period of 2019. Imports of intermediate goods totalled RM278.27 billion, decreased by 9.3%, capital goods (RM59.93 billion, down 8.5%) and consumption goods (RM47.64 billion, down 1.7%).
Note:
It should be noted that, conceptually, the export and import figures in the external trade statistics are different from that in the goods account of the balance of payments compilation. The compilation of international merchandise trade statistics is usually based on customs records, which essentially reflect the physical movement of goods across borders, and follow international guidelines on concepts and definitions i.e. International Merchandise Trade Statistics: Concepts and Definitions 2010 (IMTS 2010) which is different from the principles of the System of National Accounts (SNA) and the Balance of Payments Compilation. Goods are defined in the SNA as “physical objects for which a demand exists, over which ownership rights can be established and whose ownership can be transferred from one institutional unit to another by engaging in transactions on markets”.
“This is a preliminary release, full details would be published in the “MONTHLY EXTERNAL TRADE STATISTICS” report by the Department of Statistics, Malaysia, to be disseminated on Friday, 2nd October 2020 and can be downloaded through statistic at the Department of Statistics, Malaysia’s portal (https://www.dosm.gov.my/v1).
+ This media release can be accessed through the portal of Malaysian External Trade Statistics, Ministry of International Trade and Industry (http://www.miti.gov.my) and Malaysia External Trade Development Corporation(http://www.matrade.gov.my).
# The August 2020 data is provisional and subject to revision in later issue.
With effect from reference month April 2018, selection of codes for exports and imports of palm oil and palm oil-based products has been reviewed and revised for better representation of the product and this has resulted in some changes to the data.
FTA partners comprises of 19 countries: China, Singapore, Japan, Thailand, Republic of Korea, Indonesia, India, Australia, Viet Nam, Philippines, New Zealand, Turkey, Pakistan, Myanmar, Cambodia, Brunei, Chile, Lao PDR and Hong Kong SAR.
With effect from reference month of February 2020, the United Kingdom no longer be a Member State of the European Union (EU).
More About Malaysia Trade


.jpg)
.jpg)
.jpg)
.jpg)
.jpg)
.jpg)