Malaysia Trade Performance
October 2020 and the Period of Jan-Oct 2020

Highest Trade Surplus Recorded for the Month of October
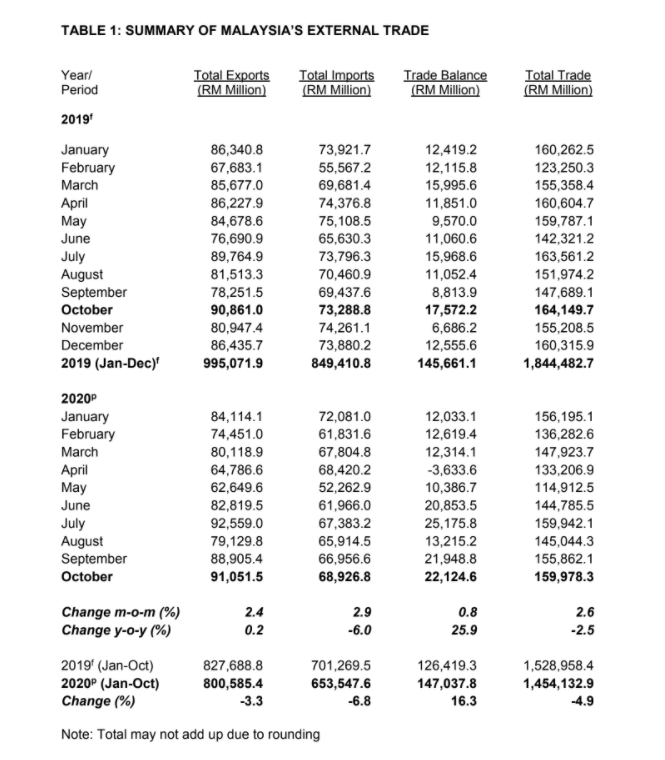
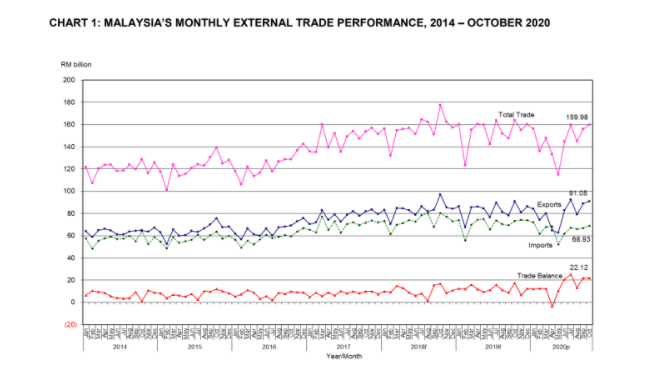
Malaysia's trade surplus in October 2020 widened to RM22.12 billion, registering a double-digit growth of 25.9% year-on-year (y-o-y) and was the highest trade surplus ever recorded for the month of October.
Exports reached RM91.05 billion in October 2020, increased by 0.2% compared to October 2019. This was the third-highest export value recorded thus far. The expansion was supported mainly by higher exports to the United States (US), China, India and the United Kingdom (UK). Imports totalled RM68.93 billion, decreased by 6% while total trade valued at RM159.98 billion, contracted by 2.5%.
Compared to September 2020, total trade, exports and imports expanded by 2.6%, 2.4% and 2.9%, respectively. Trade surplus increased by 0.8%.
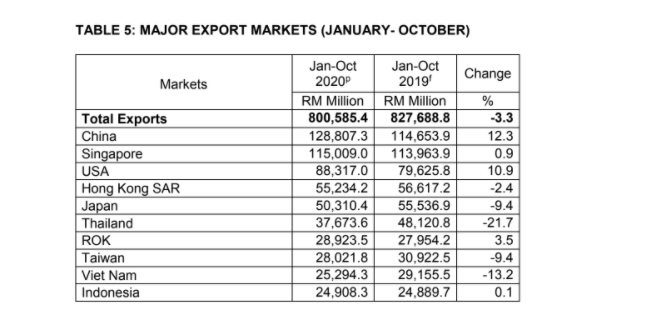
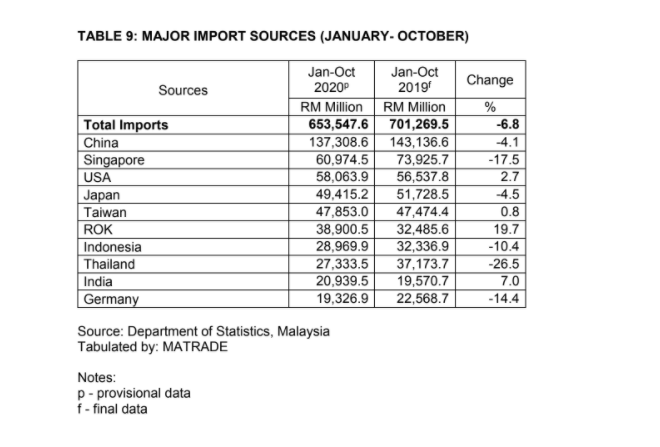
For the first 10 months of 2020, trade surplus recorded double-digit growth of 16.3% to RM147.04 billion compared to the same period of 2019. Total trade was valued at RM1.454 trillion, a decline of 4.9%. Exports which totalled RM800.59 billion, slipped by 3.3% while imports were RM653.55 billion, declined by 6.8%.
Export Performance of Major Sectors
Manufactured and Agriculture Goods Contributed to Export Growth in October
Exports of manufactured goods in October 2020 which contributed to 87.8% of total exports picked up by 2.5% y-o-y to RM79.94 billion. The growth was mainly due to higher exports of rubber products, electrical and electronic (E&E) products, other manufactures especially solid-state storage devices (SSD), iron and steel products as well as wood products.
Exports of agriculture goods (7.9% share) surged by 28.7% to RM7.17 billion compared to October 2019 boosted mainly by higher shipments of palm oil and palm oil-based agriculture products.
Exports of mining goods (3.9% share) contracted by 47.2% y-o-y to RM3.58 billion following lower exports of liquefied natural gas (LNG), crude petroleum as well as petroleum condensates and other petroleum oil.
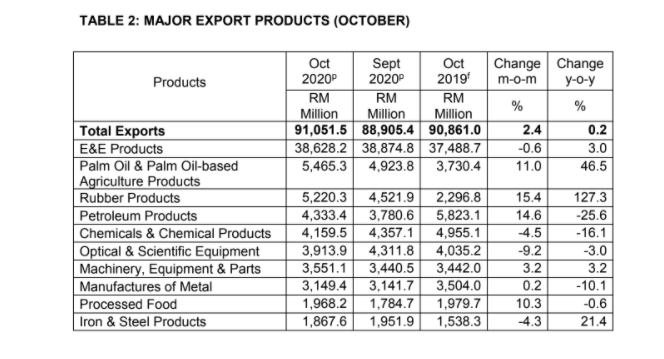
Major Exports in October 2020:
- E&E products, valued at RM38.63 billion and constituted 42.4% of total exports, increased by 3% from October 2019;
- Palm oil and palm oil-based agriculture products, RM5.47 billion, 6% of total exports, increased by 46.5%;
- Rubber products, RM5.22 billion, 5.7% of total exports, surged by 127.3%;
- Petroleum products, RM4.33 billion, 4.8% of total exports, decreased by 25.6%;
- Chemicals and chemical products, RM4.16 billion, 4.6% of total exports, declined by 16.1%
On a month-on-month (m-o-m) basis, exports of manufactured and agriculture goods rose by 2.5% and 9.5%, respectively while mining goods decreased by 10.8%.
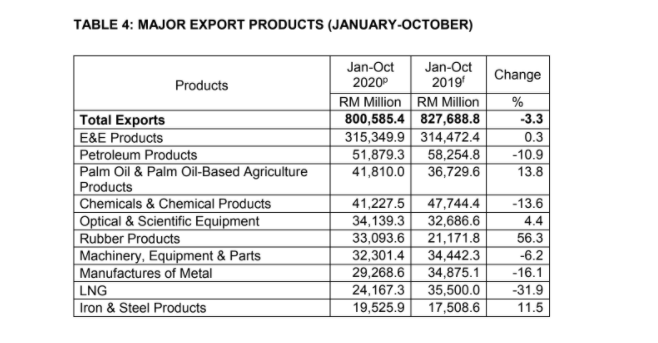
During the first 10 months of 2020, exports of manufactured goods slipped by 1.1% to RM691.29 billion compared to the same period of 2019, on account of lower exports of chemicals and chemical products, petroleum products as well as manufactures of metal. However, increases in exports were recorded for rubber products, other manufactures (SSD), iron and steel products as well as optical and scientific equipment. Exports of agriculture goods grew by 5% to RM57.68 billion mainly on account of higher exports of palm oil and palm oil-based agriculture products. Exports of mining goods fell by 29.2% to RM48.06 billion due to lower exports of LNG, crude petroleum as well as petroleum condensates and other petroleum oil.
Trade Performance with Major Markets
E&E Products Cushioned Export Decline to ASEAN
Trade with ASEAN in October 2020 which constituted RM41.15 billion or 25.7% of Malaysia’s total trade, decreased by 10.4% compared to October 2019. Exports dropped by 3.6% to RM25.73 billion owing mainly to lower exports of crude petroleum, petroleum products and manufactures of metal. The contraction however was moderated by higher exports of E&E products which increased by 18.5% or RM1.77 billion. Imports from ASEAN declined by 19.9% to RM15.42 billion.
Breakdown of exports to ASEAN countries:
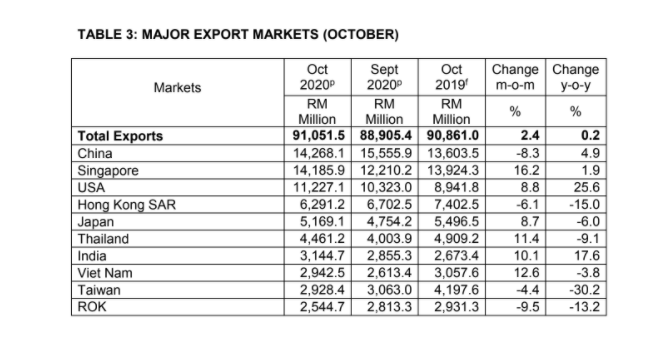
- Singapore RM14.19 billion, increased by 1.9%
- Thailand RM4.46 billion, down 9.1%
- Viet Nam RM2.94 billion, down 3.8%
- Indonesia RM2.01 billion, down 24.6%
- Philippines RM1.64 billion, up 0.6%
- Brunei RM213.2 million, up 0.9%
- Myanmar RM183.5 million, up 5.1%
- Cambodia RM93.6 million, down 25.9%
- Lao PDR RM7.0 million, up 149.3%
Exports to markets in ASEAN that recorded expansion were Singapore, which increased by RM261.6 million attributed to higher exports of E&E products, the Philippines (up RM9 million, palm oil and palm oil-based agriculture products), Brunei (up RM1.9 million, iron and steel products), Myanmar (up RM9 million, LNG) and Lao PDR (up RM4.2 million, textiles, apparels and footwear).
On an m-o-m basis, trade and exports were up by 6.1% and 11.4% respectively, while imports were down by 1.7%.
In January to October 2020, trade with ASEAN was valued at RM365.85 billion, which fell by 10.5% compared to the same period in 2019. Exports to this region edged down by 6.1% to RM223.72 billion following lower exports of crude petroleum, manufactures of metal as well as chemicals and chemical products. However, increases in exports were recorded for E&E products, transport equipment and other manufactures (SSD). Imports from ASEAN decreased by 16.7% to RM142.13 billion.
Exports Growth Momentum to China Continued
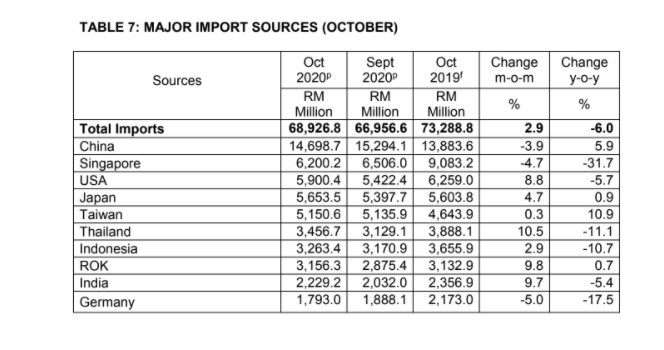
Trade with China in October 2020 rose by 5.4% y-o-y to RM28.97 billion, accounting for 18.1% of Malaysia’s total trade. Exports to China increased by 4.9% to RM14.27 billion mainly on higher exports of E&E products, iron and steel products, other manufactures (SSD), manufactures of metal as well as rubber products. Imports from China expanded by 5.9% to RM14.7 billion.
Compared to September 2020, trade, exports and imports reduced by 6.1%, 8.3% and 3.9%, respectively.
Trade with China during the period of January to October 2020 improved by 3.2% to RM266.12 billion compared to the same period in 2019. Exports recorded double digit expansion of 12.3% to RM128.81 billion, buoyed by higher exports of iron and steel products, other manufactures (SSD), manufactures of metal as well as palm oil and palm oil-based agriculture products. Imports from China amounted to RM137.31 billion, lower by 4.1%.
Double-Digit Export Growth for Five Straight Months to the US
In October 2020, trade with the US contributed 10.7% to Malaysia’s total trade, recording an expansion of 12.7% y-o-y to RM17.13 billion. Exports to the US recorded double-digit growth for five consecutive months, expanding by 25.6% to RM11.23 billion in October 2020. Increases in exports were recorded especially for rubber products, E&E products, wood products, machinery, equipment and parts as well as palm oil and palm oil-based agriculture products. Imports from the US decreased by 5.7% to RM5.9 billion.
Compared to September 2020, trade, exports and imports, all rose by 8.8%.
In the first 10 months of 2020, trade with the US was higher by 7.5% to RM146.38 billion compared to the same period of 2019. Exports grew by 10.9% to RM88.32 billion driven by higher exports of rubber products, wood products, other manufactures (SSD), E&E products as well as machinery, equipment and parts. Imports from the US increased by 2.7% to RM58.06 billion.
Exports Continued to Expand for Two Consecutive Months to the EU
Total trade with the European Union (EU) which accounted for 8.1% of Malaysia’s total trade in October 2020, decreased by 0.3% y-o-y to RM13 billion. Exports continued to expand for two consecutive months, recording a 4.7% growth to RM7.77 billion boosted by higher exports of rubber products as well as palm oil and palm oil-based agriculture products. Imports from the EU shrank by 6.8% to RM5.23 billion.
Among the top 10 EU markets which accounted for 90.2% of Malaysia’s total exports to the EU, exports to nine countries recorded increases namely, Germany (up 3.9%), France (up 0.4%), Belgium (up 27.3%), Italy (up 4%), Spain (up 7.5%), Slovenia (up 195%), Hungary (up 8.3%), Poland (up 43.5%) and the Czech Republic (up 16.1%).
Compared to September 2020, trade and exports slipped by 3.4% and 10% respectively, while imports expanded by 8.5%.
For the first 10 months of 2020, trade with the EU amounted to RM118.15 billion, a contraction of 11.9% compared to the same period of 2019. Exports totalled RM69.34 billion, decreased by 7% due to lower exports of E&E products. However, higher exports were recorded for rubber products as well as palm oil and palm oil-based agriculture products. Imports from the EU amounted to RM48.81 billion, fell by 18.1%.
Exports of Manufactured Goods to Japan Continued to Increase
In October 2020, trade with Japan which made up 6.8% of Malaysia’s total trade reduced by 2.5% y-o-y to RM10.82 billion. Exports contracted by 6% to RM5.17 billion mainly due to lower exports of LNG. Exports of manufactured goods, however, continued to expand for two consecutive months in October 2020, increased by 6.9% to RM4.04 billion mainly on higher exports of rubber products, petroleum products as well as E&E products. Imports from Japan picked up by 0.9% to RM5.65 billion.
On a m-o-m basis, trade, exports and imports grew by 6.6%, 8.7% and 4.7%, respectively.
For the period of January to October 2020, trade with Japan declined by 7% to RM99.73 billion compared to the same period of 2019. Exports decreased by 9.4% to RM50.31 billion owing to lower exports of LNG. However, increases in exports were registered for crude petroleum, rubber products, optical and scientific equipment as well as palm oil and palm oil-based agriculture products. Imports from Japan slipped by 4.5% to RM49.42 billion.
Trade with FTA Partners
In October 2020, trade with Free Trade Agreement (FTA) partners which made up 65.7% of Malaysia’s total trade was valued at RM105.12 billion, a decline of 5.4% y-o-y. Exports to FTA partners amounted to RM60.68 billion, decreased by 2.4% while imports contracted by 9.2% to RM44.43 billion.
Higher exports were recorded to India, by 17.6% to RM3.14 billion due to higher exports of palm oil and palm oil-based agriculture products, Australia (up 6.4% to RM2.09 billion, crude petroleum), Turkey (up 11.4% to RM629.5 million, rubber products), Pakistan (up 7.8% to RM432.2 million, palm oil and palm oil-based agriculture products) and Chile (up 21.3% to RM63.4 million, rubber products).
Compared to September 2020, trade, exports and imports rose by 1.5%, 2.4% and 0.2%, respectively.
Trade with FTA partners for the first 10 months of 2020 which accounted for 66.4% of Malaysia’s total trade reduced by 5.2% to RM965.71 billion. Exports amounted to RM543.96 billion, a decline of 3.5% while imports totalled RM421.75 billion, lower by 7.3%.
Import Performance
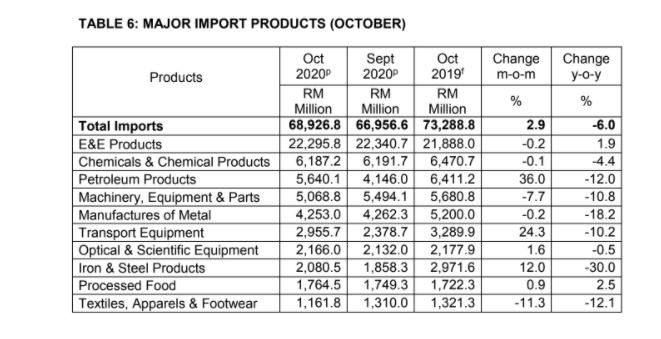
Total imports in October 2020 contracted by 6% y-o-y to RM68.93 billion from RM73.29 billion in October 2019. The three main categories of imports by end-use which accounted for 70.8% of total imports were:
- Intermediate goods, valued at RM35.27 billion or 51.2% share of total imports, decreased by 6.1%, following lower imports of processed industrial supplies, particularly nickel and articles;
- Capital goods, valued at RM7.02 billion or 10.2% of total imports, declined by 17.1%, due mainly to reduced imports of capital goods (except transport equipment), primarily electrical machinery, equipment and parts; and
- Consumption goods, valued at RM6.53 billion or 9.5% of total imports, rose by 6.5%, as a result of higher imports of non-industrial transport equipment.
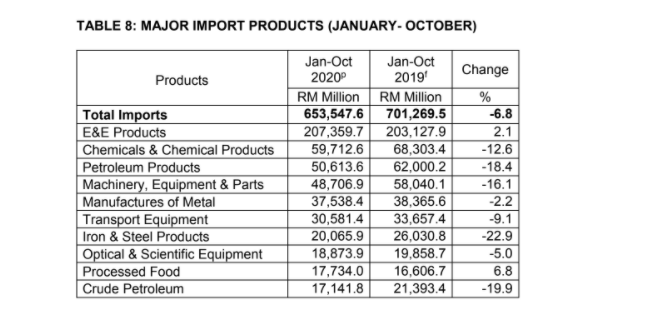
During January to October 2020, imports amounted to RM653.55 billion, decreased by 6.8% from the same period of 2019. Imports of intermediate goods totalled RM346.41 billion, decreased by 9.9%, capital goods (RM74.57 billion, down 8.8%) and consumption goods (RM60.8 billion, up 0.4%).
Note:
It should be noted that, conceptually, the export and import figures in the external trade statistics are different from that in the goods account of the balance of payments compilation. The compilation of international merchandise trade statistics is usually based on customs records, which essentially reflect the physical movement of goods across borders, and follow international guidelines on concepts and definitions i.e. International Merchandise Trade Statistics: Concepts and Definitions 2010 (IMTS 2010) which is different from the principles of the System of National Accounts (SNA) and the Balance of Payments Compilation. Goods are defined in the SNA as “physical objects for which a demand exists, over which ownership rights can be established and whose ownership can be transferred from one institutional unit to another by engaging in transactions on markets”.
“This is a preliminary release, full details would be published in the “MONTHLY EXTERNAL TRADE STATISTICS” report by the Department of Statistics, Malaysia, to be disseminated on Friday, 4th December 2020 and can be downloaded through statistic at the Department of Statistics, Malaysia’s portal (https://www.dosm.gov.my/v1).
+ This media release can be accessed through the portal of Malaysian External Trade Statistics, Ministry of International Trade and Industry (http://www.miti.gov.my) and Malaysia External Trade Development Corporation (http://www.matrade.gov.my).
# The October 2020 data is provisional and subject to revision in a later issue.
With effect from reference month April 2018, selection of codes for exports and imports of palm oil and palm oil-based products have been reviewed and revised for better representation of the product and this has
resulted in some changes to the data.
FTA partners comprise of 19 countries: China, Singapore, Japan, Thailand, Republic of Korea, Indonesia, India, Australia, Viet Nam, Philippines, New Zealand, Turkey, Pakistan, Myanmar, Cambodia, Brunei, Chile, Lao PDR and Hong Kong SAR.
With effect from reference month of February 2020, the United Kingdom no longer be a Member State of the European Union (EU).