Malaysia External Trade Statistics
Trade Performance for Aug 2021 and the Period of Jan-Aug 2021
Double-Digit Growth for Trade, Exports, Imports and Trade Surplus in August 2021
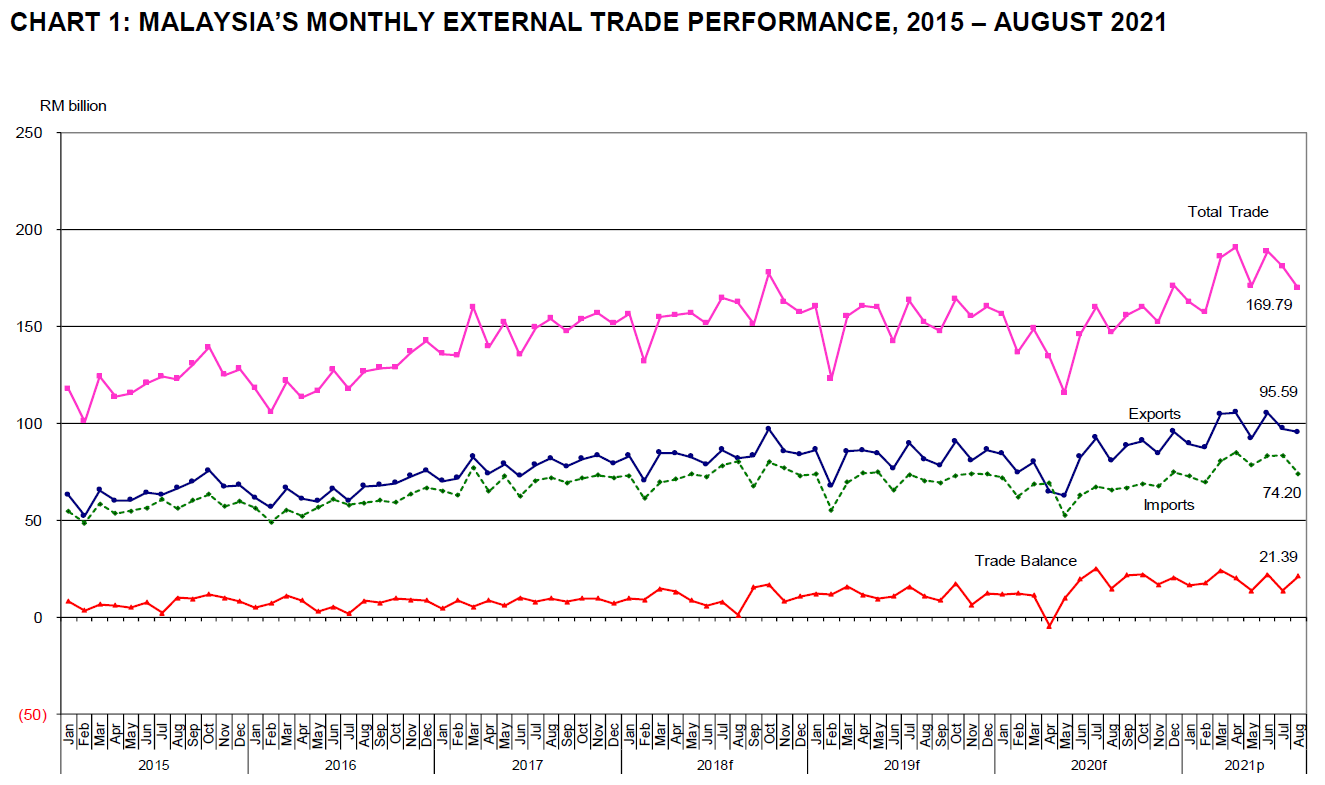
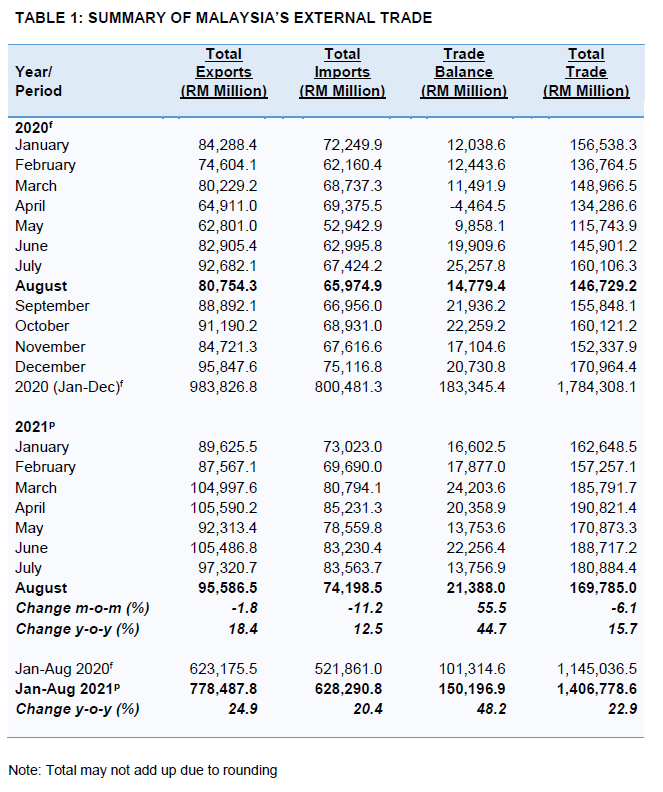
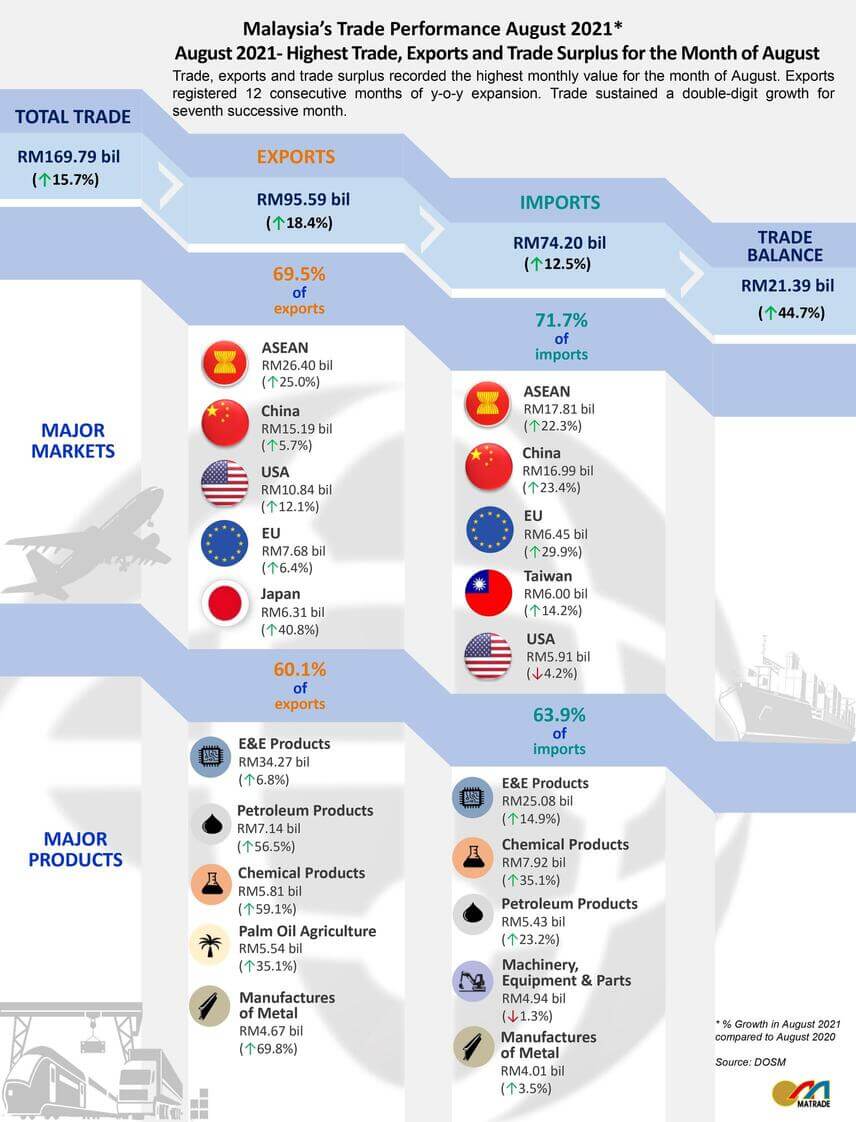
Malaysia’s trade performance remained resilient and maintained its upward momentum in August 2021. Trade increased by 15.7% to RM169.79 billion compared to August 2020, the seventh consecutive month of double-digit growth since February 2021. Exports grew by 18.4% to RM95.59 billion, the 12th consecutive month of year-on-year (y-o-y) expansion since September 2020. Imports expanded by 12.5% to RM74.2 billion while trade surplus was up by 44.7% to RM21.39 billion. Trade, exports and trade surplus registered the highest monthly value for August.
The export growth was contributed mainly by robust external demand for petroleum products, electrical and electronic (E&E) products mainly due to higher shipments of semiconductors as well as chemicals and chemical products. Exports to all major markets namely ASEAN, China, the United States (US), the European Union (EU), and Japan recorded positive growth.
On a month-on-month (m-o-m) basis, trade surplus surged by 55.5% while trade, exports and imports declined by 6.1%, 1.8% and 11.2% respectively.
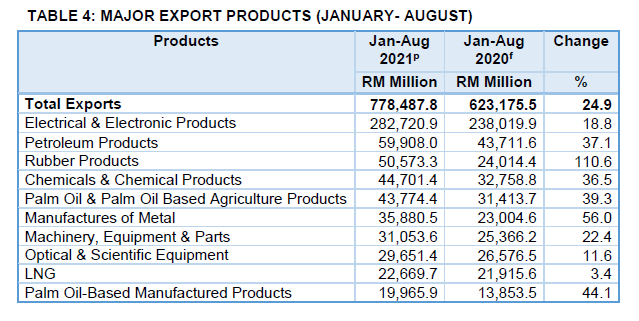
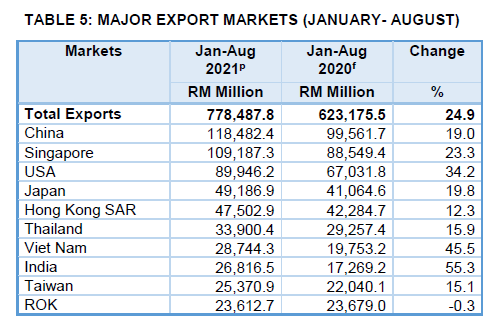
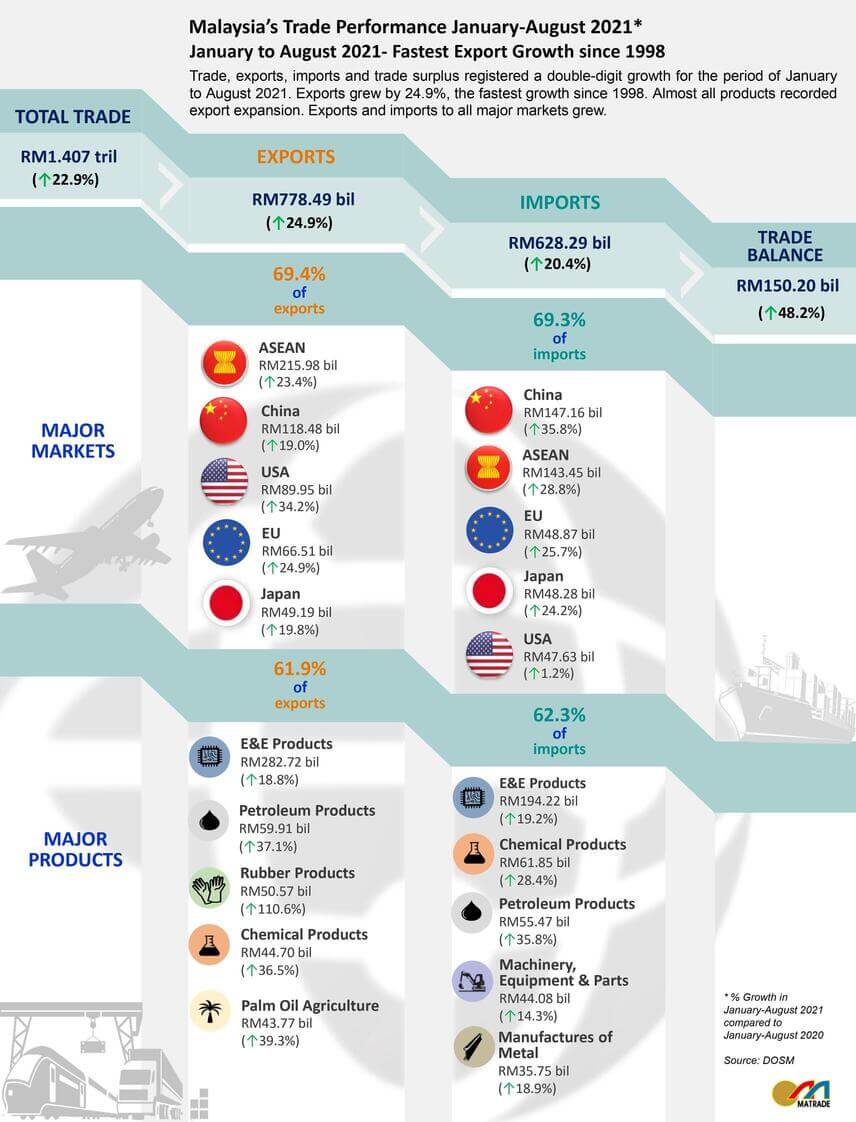
For the first eight months of 2021, trade expanded by 22.9% to RM1.407 trillion from the same period last year. Exports for the period grew by 24.9% to RM778.49 billion, the fastest growth recorded since 1998. Imports rose by 20.4% to RM628.29 billion and trade surplus surged by 48.2% to RM150.2 billion.
Export Performance of Major Sectors
Strong Double-Digit Export Growth Recorded for All Sectors
In August 2021, exports of manufactured goods accounted for 84.6% of total exports, registering a growth of 15.4% y-o-y to RM80.83 billion. Petroleum products, E&E products, chemicals and chemical products, manufactures of metal as well as palm oil-based manufactured products registered more than RM1 billion expansion in exports.
Exports of agriculture goods (7.7% share) rose by 28.5% to RM7.34 billion compared to August 2020, the sixth consecutive month of double-digit growth since March 2021. This was supported mainly by higher exports of palm oil and palm oil-based agriculture products.
Exports of mining goods (7.4% share) surged by 50.6% y-o-y to RM7.05 billion, the fifth straight month of double-digit growth since April 2021. The increase was buoyed mainly by higher exports of liquefied natural gas (LNG) which increased by RM1.86 billion.
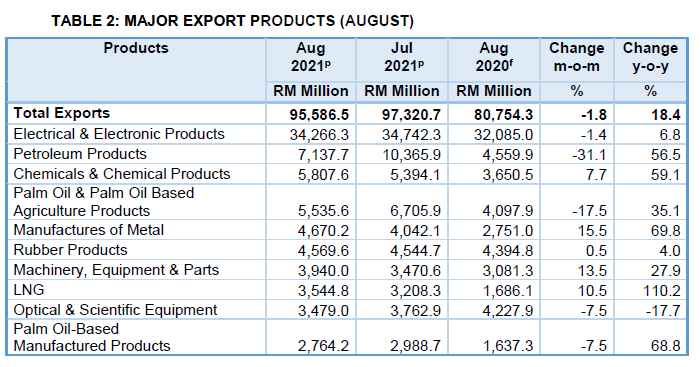
Major exports in August 2021:
- E&E products, valued at RM34.27 billion and accounted for 35.8% of total exports, increased by 6.8% from August 2020;
- Petroleum products, RM7.14 billion, 7.5% of total exports, increased by 56.5%;
- Chemicals and chemical products, RM5.81 billion, 6.1% of total exports, increased by 59.1%;
- Palm oil and palm oil-based agriculture products, RM5.54 billion, 5.8% of total exports, increased by 35.1%; and
- Manufactures of metal, RM4.67 billion, 4.9% of total exports, increased by 69.8%.
Compared to July 2021, exports of mining goods expanded by 24.9% while exports of manufactured and agriculture goods were down by 2.4% and 13.3%, respectively.
For the period of January to August 2021, almost all products recorded export expansion. Exports of manufactured goods increased by 25.8% to RM673.01 billion compared to the same period of 2020, boosted by higher exports of E&E products, rubber products, petroleum products, manufactures of metal as well as chemicals and chemical products. Exports of agriculture goods rose by 32.1% to RM58.13 billion attributed to higher exports of palm oil and palm oil-based agriculture products. Exports of mining goods rose by 7.6% to RM44.35 billion underpinned by higher exports of LNG and crude petroleum.
Trade Performance with Major Markets
ASEAN – Double-Digit Growth for Trade, Exports and Imports
In August 2021, trade with ASEAN edged up by 23.9% y-o-y to RM44.21 billion, contributed 26% to Malaysia’s total trade. Exports increased by 25% to RM26.4 billion, owing to higher exports of E&E products and petroleum products. Imports from ASEAN expanded by 22.3% to RM17.81 billion.
- Breakdown of exports to ASEAN countries:
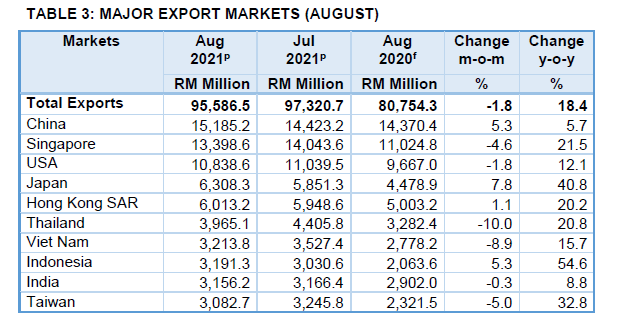
- Singapore RM13.40 billion, increased by 21.5%
- Thailand RM3.97 billion, increased by 20.8%
- Viet Nam RM3.21 billion, increased by 15.7%
- Indonesia RM3.19 billion, increased by 54.6%
- Philippines RM1.99 billion, increased by 38.8%
- Brunei RM326.4 million, increased by 76.5%
- Cambodia RM157.1 million, increased by 34.2%
- Myanmar RM150.9 million, decreased by 33.1%
- Lao PDR RM3.1 million, decreased by 10.9%
Exports to major markets in ASEAN that recorded expansion were Singapore which increased by RM2.37 billion, due to higher exports of E&E products, Thailand (up RM682.7 million, crude petroleum), Viet Nam (up RM435.6 million, E&E products), Indonesia (up RM1.13 billion, petroleum products) and the Philippines (up RM556 million, palm oil and palm oil-based agriculture products).
Compared to July 2021, imports increased by 0.9% while trade and exports declined by 2.4% and 4.5%, respectively.
In the first eight months of 2021, trade with ASEAN rose by 25.5% to RM359.42 billion compared to the same period of 2020. Exports to this region grew by 23.4% to RM215.98 billion boosted by higher exports of E&E products, petroleum products, chemicals and chemical products, manufactures of metal as well as machinery, equipment and parts. Imports from ASEAN expanded by 28.8% to RM143.45 billion.
China – Trade Recorded Ninth Consecutive Month of Double-Digit Growth
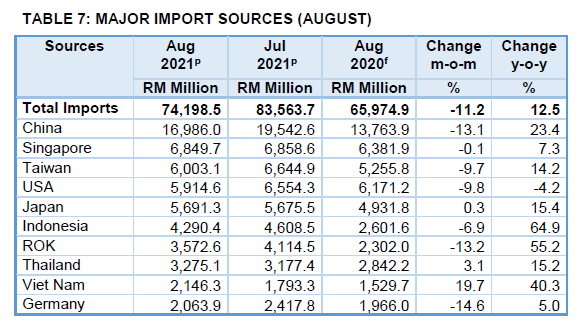
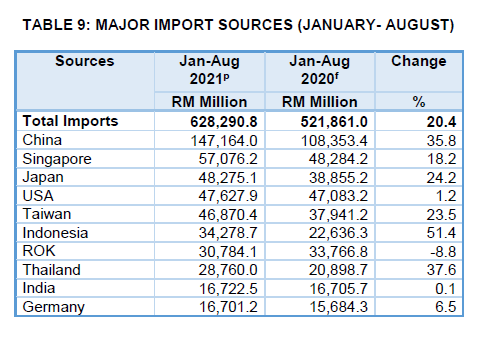
In August 2021, trade with China recorded a growth of 14.3% y-o-y to RM32.17 billion, the ninth consecutive month of double-digit expansion and represented 18.9% of Malaysia’s total trade. Exports to China improved by 5.7% to RM15.19 billion following higher exports of LNG as well as chemicals and chemical products. Imports from China rose by 23.4% to RM16.99 billion.
Compared to July 2021, exports increased by 5.3%, while trade and imports contracted by 5.3% and 13.1%, respectively.
Trade with China during the first eight months of 2021 grew by 27.8% to RM265.65 billion compared to the same period of 2020. Exports edged up by 19% to RM118.48 billion on the back of higher exports of E&E products, LNG, manufactures of metal as well as chemicals and chemical products. Imports from China rose by 35.8% to RM147.16 billion.
The US – Exports Rebounded with a Double-Digit Growth
Trade with the US in August 2021 accounted for 9.9% of Malaysia’s total trade or RM16.75 billion, an increase of 5.8% y-o-y. Exports rebounded by 12.1% to RM10.84 billion on higher exports of E&E products, rubber products as well as machinery, equipment and parts. Imports from the US slipped by 4.2% to RM5.91 billion.
On a m-o-m basis, trade, exports and imports contracted by 4.8%, 1.8% and 9.8%, respectively.
For the period of January to August 2021, trade with the US rose by 20.6% to RM137.57 billion compared to the same period of 2020. Exports expanded by 34.2% to RM89.95 billion on account of higher exports of rubber products, E&E products, machinery, equipment and parts as well as optical and scientific equipment. Imports from the US increased by 1.2% to RM47.63 billion.
The EU – Trade, Exports and Imports Remained Strong
Trade with the EU which comprised 8.3% of Malaysia’s total trade in August 2021 rose by 16% y-o-y to RM14.13 billion. Exports grew by 6.4% to RM7.68 billion following higher exports of palm oil and palm oil-based products, manufactures of metal as well as petroleum products. Imports from the EU increased by 29.9% to RM6.45 billion.
Breakdown of exports to the top 10 EU markets which accounted for 90.8% of Malaysia’s total exports to the EU were:
- Netherlands RM2.46 billion, increased by 27.4%
- Germany RM2.09 billion, decreased by 3.7%
- Belgium RM481.6 million, increased by 32.7%
- Italy RM476.8 million, decreased by 1.6%
- Spain RM371.3 million, increased by 19%
- France RM331.4 million, decreased by 29%
- Czech Republic RM263.8 million, increased by 23.5%
- Slovenia RM182.4 million, decreased by 23.1%
- Poland RM173.9 million, decreased by 10.8%
- Hungary RM140.9 million, decreased by 17.4%
Exports to the EU major markets that grew were the Netherlands which increased by RM528.7 million due to higher demand for palm oil and palm oil-based agriculture products, Belgium (up RM118.8 million, petroleum products) and Spain (up RM59.3 million, palm oil-based manufactured products).
On a month-on-month basis, trade, exports and imports contracted by 5.4%, 2.8% and 8.4%, respectively.
During the first eight months of 2021, trade with the EU expanded by 25.2% to RM115.38 billion compared to the same period of 2020. Exports increased by 24.9% to RM66.51 billion, buoyed by higher exports of rubber products, E&E products as well as palm oil-based manufactured products. Imports from the EU rose by 25.7% to RM48.87 billion.
Japan – Sixth Consecutive Month of Double-Digit Export Expansion
In August 2021, trade with Japan which accounted for 7.1% of Malaysia’s total trade expanded by 27.5% y-o-y to RM12 billion. Exports surged by 40.8% to RM6.31 billion, the sixth consecutive month of double-digit y-o-y expansion since March 2021. The increase was due to higher exports of LNG, manufactures of metal, crude petroleum, wood products as well as palm oil and palm oil-based agriculture products. Imports from Japan edged up by 15.4% to RM5.69 billion.
Compared to July 2021, trade, exports and imports expanded by 4.1%, 7.8% and 0.3%, respectively.
For the period of January to August 2021, trade with Japan grew by 21.9% to RM97.46 billion compared to the same period of 2020. Exports increased by 19.8% to RM49.19 billion contributed by higher exports of E&E products, manufactures of metal and rubber products. Imports from Japan rose by 24.2% to RM48.28 billion.
Trade with FTA Partners
In August 2021, trade with Free Trade Agreement (FTA) partners which accounted for 67.3% of Malaysia’s total trade expanded by 19.5% y-o-y to RM114.31 billion. Exports to FTA partners increased by 20% to RM64.98 billion and imports grew by 18.8% to RM49.33 billion.
Increase in exports was recorded to Hong Kong SAR, by 20.2% to RM6.01 billion due to higher exports of E&E products, Australia, (up 38.9% to RM2.95 billion, petroleum products), Turkey (up 63.8% to RM1.11 billion, manufactures of metal), Pakistan (up 106.5% to RM636.4 million, petroleum products), New Zealand (up 127.5% to RM497.3 million, crude petroleum), India (up 8.8% to RM3.16 billion, chemicals and chemical products) and Chile (up 1.6% to RM57.5 million, palm oil-based manufactured products).
Compared to July 2021, exports increased by 0.4% while trade and imports declined by 2% and 5.1%, respectively.
Trade with FTA partners during the first eight months of 2021 which constituted 66.7% of Malaysia’s total trade, expanded by 23.1% to RM937.74 billion compared to the same period of 2020. Exports grew by 22.1% to RM519.84 billion and imports rose by 24.4% to RM417.9 billion.
Import Performance
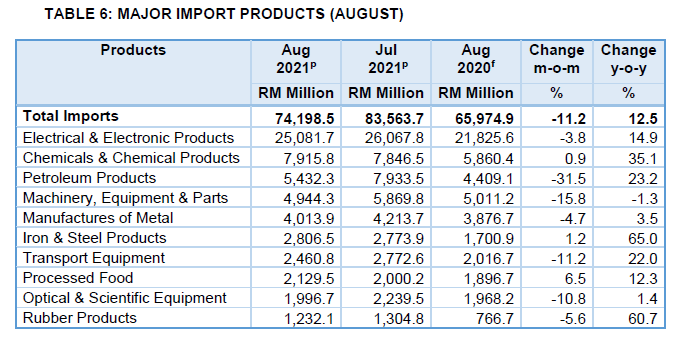
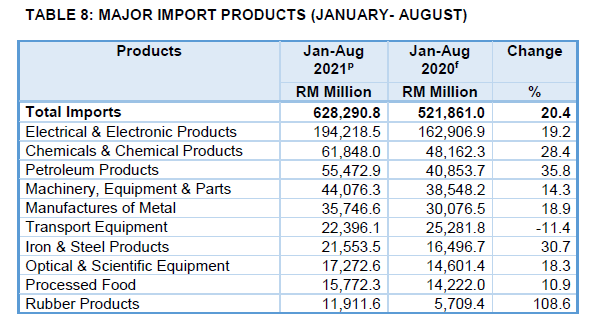
Total imports in August 2021 grew by 12.5% y-o-y to RM74.2 billion. The three main categories of imports by end-use which accounted for 76.9% of total imports were:
- Intermediate goods, valued at RM42.4 billion or 57.1% of total imports, increased by 13.4%, following higher imports of processed industrial supplies particularly iron and steel;
- Capital goods, valued at RM8.32 billion or 11.2% of total imports, grew by 22.9%, due to higher imports of capital goods (except transport equipment), primarily parts for machinery and mechanical appliances; and
- Consumption goods, valued at RM6.35 billion or 8.6% of total imports, declined by 0.6%, as a result of lower imports of durables, especially parts for machinery and mechanical appliances.
During the period of January to August 2021, imports expanded by 20.4% to RM628.29 billion from the same period of 2020. Imports of intermediate goods grew by 22.9% to RM347.63 billion, capital goods (up 10.7% to RM66.73 billion,) and consumption goods (up 13.5% to RM54.34 billion).
Note:
It should be noted that, conceptually, the export and import figures in the external trade statistics are different from that in the goods account of the balance of payments compilation. The compilation of international merchandise trade statistics is usually based on customs records, which essentially reflect the physical movement of goods across borders, and follow international guidelines on concepts and definitions i.e. International Merchandise Trade Statistics: Concepts and Definitions 2010 (IMTS 2010) which is different from the principles of the System of National Accounts (SNA) and the Balance of Payments Compilation. Goods are defined in the SNA as “physical objects for which a demand exists, over which ownership rights can be established and whose ownership can be transferred from one institutional unit to another by engaging in transactions on markets”.
“This is a preliminary release, full details would be published in the “MONTHLY EXTERNAL TRADE STATISTICS” report by the Department of Statistics, Malaysia, to be disseminated on Monday, 4th October 2021 and can be downloaded through statistic at the Department of Statistics, Malaysia’s portal (https://newss.statistics.gov.my/newss-portalx/ep/epLogin.seam).
+ This media release can be accessed through the portal of Malaysian External Trade Statistics, Ministry of International Trade and Industry (http://www.miti.gov.my) and Malaysia External Trade Development Corporation (http://www.matrade.gov.my).
The August 2021 data is provisional and subject to revision in later issue.
With effect from reference month April 2018, selection of codes for exports and imports of palm oil and palm oil-based products has been reviewed and revised for better representation of the product and this has resulted in some changes to the data.
FTA partners comprises of 19 countries: China, Singapore, Japan, Thailand, Republic of Korea, Indonesia, India, Australia, Viet Nam, Philippines, New Zealand, Turkey, Pakistan, Myanmar, Cambodia, Brunei, Chile, Lao PDR and Hong Kong SAR.
With effect from reference month of February 2020, the United Kingdom no longer be a Member State of the European Union (EU).
Source: Department of Statistics, Malaysia
Tabulated by MATRADE
Notes: p - Provisional Data
f - Final Data